No edit summary |
No edit summary |
||
| Line 1: | Line 1: | ||
{{CaseStudy | {{CaseStudy | ||
[[File:Frailty graph_June 2020.png|250px|right]] | |||
|The NHS 111 Discovery frailty flagging project utilises Discovery data to flag key information to NHS 111 call handlers to improve the patient pathway and experience, and reduce the unnecessary use of emergency services and admission to A&E. | |The NHS 111 Discovery frailty flagging project utilises Discovery data to flag key information to NHS 111 call handlers to improve the patient pathway and experience, and reduce the unnecessary use of emergency services and admission to A&E. | ||
Since the project went live in November 2018, the Discovery Data Service has: | Since the project went live in November 2018, the Discovery Data Service has: | ||
| Line 11: | Line 12: | ||
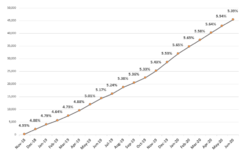
The graph shows the cumulative totals and the percentage of potentially frail patients compared to the total number of matched patients. | The graph shows the cumulative totals and the percentage of potentially frail patients compared to the total number of matched patients. | ||
|All patients within Inner East London; City and Hackney, Tower Hamlets, Waltham Forest, and Newham CCGs and uses a [[frailty algorithm]]. | |All patients within Inner East London; City and Hackney, Tower Hamlets, Waltham Forest, and Newham CCGs and uses a [[frailty algorithm]]. | ||
Revision as of 16:24, 23 July 2020
{{CaseStudy
|The NHS 111 Discovery frailty flagging project utilises Discovery data to flag key information to NHS 111 call handlers to improve the patient pathway and experience, and reduce the unnecessary use of emergency services and admission to A&E.
Since the project went live in November 2018, the Discovery Data Service has:
- matched 843,462 patients
- flagged 45,421 potentially frail patients
- Latest update: 2 July 2020
The following graph shows the number of patients that have been flagged as potentially frail and have therefore been fast tracked to speak directly to a clinician who can provide personalised care.
The graph shows the cumulative totals and the percentage of potentially frail patients compared to the total number of matched patients.
|All patients within Inner East London; City and Hackney, Tower Hamlets, Waltham Forest, and Newham CCGs and uses a frailty algorithm.
|Frail patients
|See the frailty algorithm page for more details.
|Patient identifiable }}
